Sometimes, it can be an aggravating challenge to figure out exactly which bits of your site’s code are controlling a specific part of your WordPress website. Sure you can view the source code of your website, but that only shows you the HTML initially. You could then go hunt down the CSS stylesheet but chances are, there’s more than one stylesheet (e.g. from WordPress plugins).

Assuming you find the right stylesheet, you’re going to have to do a search/find operation – and even then you’re not necessarily entirely sure. That’s not just true for coding novices, by the way – even expert developers often find this process annoying and time-consuming. Nowadays each major browser offers its own set of browser-based developer tools that lets you find the specific lines of code responsible for any part of your page and even experiment with and fine tune that code as preferred. Chrome, Safari, Firefox and Microsoft Edge all give you access to these more advanced development tools. While the tools do a lot more than just inspect and let you experiment with HTML and CSS, that’s the function we’re going to take a closer look at in this article.
- What browser developer tools can do
- Using the Firefox browser
- Using the Chrome browser
- Using the Safari browser
- Using the Edge browser
- How to use browser developer tools
- Implementing your changes
What browser developer tools can do #
As you probably already know, each web page on your WordPress website is created through a combination of different kinds of code, the two major ones being HTML and CSS. In the case of WordPress, as with many other CMS and web technologies, there are also other kinds of code involved, such as PHP, jQuery or regular JavaScript.

Since this article is looking at code inspection tools, we’re going to focus on the two languages that are responsible primarily for the stuff you see on the page. HTML markup covers the basic elements and content of your page – the <h3>s (headings) and the <p>s (paragraphs) for instance. CSS styles those elements in specific ways – for example, by setting properties such as font families, font sizes, colors, alignment, font weight, animations, and much, much more.
The problem is that it’s not always so simple to figure out which specific lines of code are governing the way a specific part of the page in question is behaving or being displayed. There’s the HTML (which may be different for each page), as well as one or more CSS stylesheets (usually each its own separate file). So even if you’d want to visually scan and search for possible lines of code, it could take awhile, depending on the size and complexity of your WordPress website.
If you want to learn more basics of HTML and CSS, please also see these beginner tutorials:
The basic idea behind browser developer tools is that they let you accomplish this nearly instantly. So, just by designating a specific part of the page or website element you’re looking at, these tools can: Instantly identify the HTML and CSS code responsible for that certain part of the page; and easily experiment with that code with live previews so you can see the results of a proposed CSS change instantly on the page you are currently looking at.
So if you can’t figure out why a H3 heading isn’t displaying at the right font size, or why your hover links aren’t changing color the way they’re supposed to, then these tools can make your life so much easier. Fortunately almost all major browsers offer these tools; below, you can see screenshots from each inspector tool’s display and information on how to access the tools for each.
Firefox #

You can access the Firefox tools in a few ways:
- If you have selected a particular element on the page, just right-click on that element and select inspect element. Upon your right-click the inspection screen will open in your browser.
- Otherwise, you can choose the Inspector option from the Web Developer menu.
Chrome #

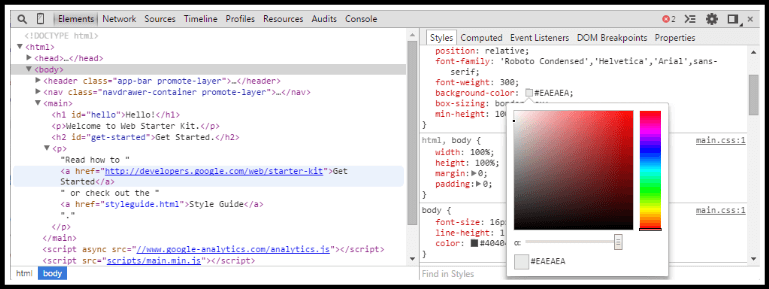
For the Chrome DevTools, either right-click on the page element and click inspect element, or use the Chrome menu to select Tools => Developer Tools. You can also use hotkey shortcuts:
- Ctrl+Shift+I (Cmd+Opt+I on Mac) will open the DevTools
- Ctrl+Shift+J (Cmd+Opt+J on Mac) will open the DevTools with focus on the Console
- Ctrl+Shift+C (Cmd+Shift+C on Mac) opens the tools in Inspect Element mode
Safari #

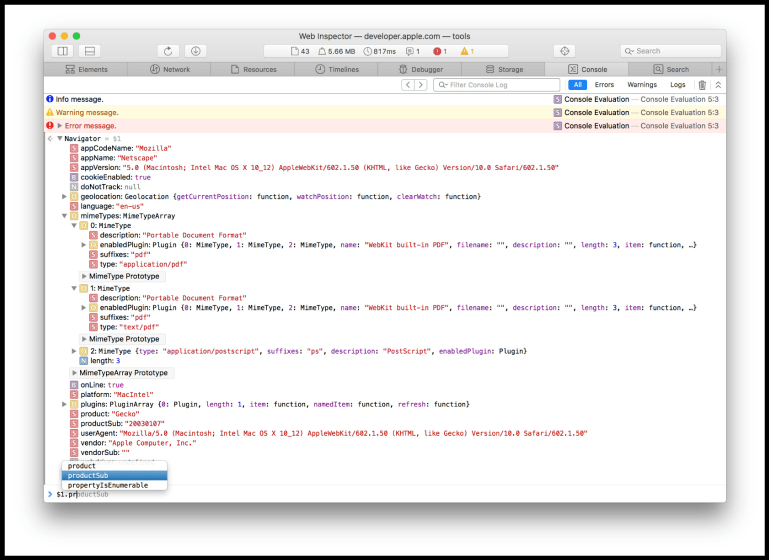
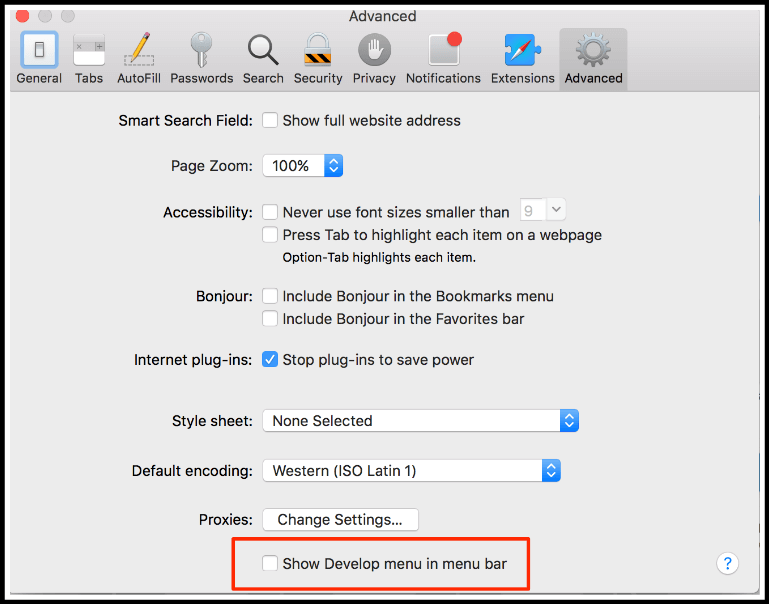
To access the Safari inspector functions, first enable the Developer menu by going to Preferences => Advanced and clicking the box at the bottom, as shown in the screenshot below:

Edge #

The DOM Explorer tools for Edge can be accessed simply by using the hotkey combo CTRL + 1.
How to use browser developer tools #
Once you’ve selected a specific element and called up the inspection tools, regardless of which browser you’re using (note that there might be some differences between each set of tools, though the overall approach is fairly similar), you’ll see the HTML code in one part of the inspector window, and the associated CSS in the other part of the screen. The inspection tools give you a much better at a glance look at specific chunks of your code and how they display in the browser window.

When you’re first learning how to navigate and use these tools, it’s useful to take a look at several different sites other than your own using the tools. This helps you identify how the tools function without the site blindness that can sometimes infect website owners and developers when they’re deeply familiar with a specific site they’ve built.
Of course, the most utility comes from using the tools to debug and refine your own site. Initially, you’ll want to identify the problem area on the page in question and review the associated code just to get that deeper big picture view of what’s happening on the page. From there, you can either edit the code, or delete it altogether. Deletion can be helpful, especially when you’re trying to debug or figure out why an adjacent element isn’t displaying properly.
Implementing your changes #
After you’ve perfected your code, you can live preview your changes in that active browser window – but those changes will be lost the minute you refresh, or navigate away, of course. You could add the new CSS rules to your live editor within your WordPress dashboard, but this is really bad coding practice. The reason is simple: next time you update / change theme files, you’ll lose those changes.

Instead, if you want to adhere to coding best practices and preserve your changes the right, clean, and stable way, you’ll need to create a child theme and put your new rules in it or use a plugin to add custom CSS code to your website. If that makes you nervous, don’t worry! If you can write CSS property rules, you can absolutely create a WordPress child theme. And MH Themes will also walk you through the process with this tutorial on how to create and use child themes in WordPress.
Conclusion: Using browser code inspection tools #
Browser developer tools are an incredibly useful set of development aids, whether you are a professional developer or you are simply trying to refine your own WordPress website. To make sure your WordPress website is displaying correctly for the majority of your users, you’ll want to take advantage of the browser development tools for each major browser.
Install each of the major browsers installed on your laptop or desktop computer, in their most recent iterations. Then load your website, or the site you’re working on currently, in each of those browsers and examine them with the developer tools.
